In this post, we present the built-in gdbstub that has been developed in the last three months. The gdbstub enables a user to connect to a Toro microVM instance for debugging.
One way to debug an Operating System or a unikernel that is using the QEMU built-in gdbstub. This does not require any instrumentation in the guest and works well when only QEMU is used. However, the QEMU built-in gdbstub does not work well when using KVM and the microvm machine (https://forum.osdev.org/viewtopic.php?f=13&t=39998). For example, software breakpoints and hardware breakpoints are not correctly caught. Another way to debug a guest is to include a gdbstub in the kernel or unikernel. This is the approach that Linux follows and the approach that Toro microVM follows too.
When a kernel includes a gdbstub, it is possible to debug it independently of the Virtual Machine Monitor (VMM), e.g., QEMU, firecracker. This only requires a way to connect the gdb client with the gdbstub, i.e., serial port or any other device. In our case, the communication between the gdb client and the gdbstub is based on the virtio-console device. QEMU is used to forward the serial port to a tcp port to which the gdb client connects.
The gdbstub implements the GDB remote protocol to talk with a gdb client (see https://www.embecosm.com/appnotes/ean4/embecosm-howto-rsp-server-ean4-issue-2.html#sec_exchange_target_remote). This allows a gdbclient to set breakpoints and execute step-by-step. However, the current implementation does not support the pause command, which remains future work.
The gdbstub interfaces between the gdbclient and the underlying debugging hardware. The x86 architecture enables programmers to set breakpoints and execute step-by-step. In the following, we explain how the gdbstub uses these features.
To set a breakpoint, the gdbstub simply replaces the value of the first byte of an instruction in memory by the hexadecimal value 0xcc. When the processor executes this instruction, it triggers the interruption number 3, i.e., INT3. The gdbstub handles this interruption by informing the gdb client that the program has catched a breakpoint.
The gdb client reads the value of the Instruction Pointer (RIP) to figure out which breakpoint corresponds to, and then, informs the end-user. At this point, the user can continue the execution with the “continue” command or execute the next instruction by using the “step” command.
In the interruption handler, the value of the RIP register in the stack corresponds with the RIP_BREAKPOINT + 1. This prevents from triggering the same breakpoint when returning from the interruption.
The “step” command set the processor in “step” mode. The single step mode is controlled by a flag in the RFLAG register. In this mode, the processor triggers the interruption number 1 just after each instruction has executed. During the execution of the interruption handler, this flag is disabled and it is only enabled when returning from the interruption. In step mode, the execution is instruction by instruction. Thus, to execute a line of code, several executions may be needed until the next pascal line is reached. Note that the current implementation does not use the x86 breakpoint registers to set breakpoints.
To allow a smoothly debugging experience, the communication between the gdbclient and the gdbstub must be fast. In this path, two elements are crucial: the serial driver in the guest and the forwarding of such information to a tcp port. The microvm machine only enables one legacy serial port. When using the legacy serial port, the communication relies on a single byte of information. QEMU packages this byte into a single tcp packet and sends it to the client. This results in a poor communication in term of performance. Instead, we use the virtio-console device to communicate the gdbclient and the gdbstub. This has two benefits: first the gdbclient can send chunks of data instead of single bytes. Second, QEMU handles the tcp communication more efficiently, for example, by packaging more data into each packet. In the overall, the use of virtio-console results in an improvement of the performance. To avoid nested interruption in the gdbstub interruption handler, the current driver is implemented by relying on a pooling mechanism.
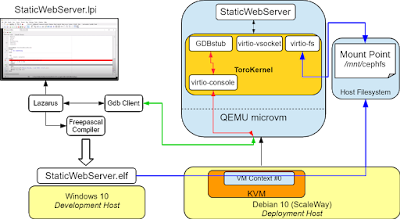
The resulting software architecture is illustrated in the following figure:
The user builts the application in the development host, which is a Windows 10 host with Freepascal and Lazarus. We use Lazarus as front-end for the gdbclient. This allows users to debug applications by using a graphical interface. The binary of the application is transferred to the deployment host in which the VM within the application is created. This host is a Debian 10 and the application is deployed as a KVM/QEMU microvm guest. The binary of the application is stored in a cephs cluster that is shared among other hosts. When the VM is instantiated, QEMU waits until the gdb client connects to the port tcp:1234. When this happens, the guest continues to execute (watch the whole flow at https://youtu.be/AdygWtGQFPU).
In this post, we presented the built-in gdbstub to debug applications in Toro microVM. When included in an application, this module allows communication to a gdbclient thus allowing users to set breakpoints, execute step-by-step and inspect the value of variables.
Bibliography:
- https://sourceware.org/gdb/onlinedocs/gdb/Notification-Packets.html#Notification-Packets
- https://eli.thegreenplace.net/2011/01/27/how-debuggers-work-part-2-breakpoints
- https://github.com/mborgerson/gdbstub

No comments:
Post a Comment